Pages

Thursday, August 31, 2017

Dissecting and Experimenting to Extend the IoT Edge Gateway-Part II

Overview

This blog is an extension of Developing Azure IoT Edge-Part I.  Picking up from the Conclusion section from the Part I, the goals for this blog are to explore following objectives.

  • Exploring SensorTag capabilities
  • Providing clarity on the telemetry data by dissecting the IoT Edge code base.
  • Connecting this telemetry output to do Hot Path/Warm Path/Cold Path analytics.
  • Connecting additional SensorTags to the same Raspberry Pi IoT Edge Gateway

Exploring SensorTag Capabilities

Before we dive in to the telemetry data, lets first take look at the Sensor device itself to better understand what we are ready from it. My SensorTag model number is CC2650. This sensor has quite a punch to the list of sensors it has!

10 low-power MEMS sensors. Imagine all the interesting IoT features you could implement with this cost effective tiny sensor!

  1. light
  2. digital microphone
  3. magnetic sensor
  4. humidity
  5. pressure
  6. accelerometer
  7. gyroscope
  8. magnetometer
  9. object temperature (Make note of this)
  10. ambient temperature (Make note of this)

clip_image001

Understanding the Telemetry Data from IoT Edge

From the output of running the IoT Edge in the Pi terminal, you see below output under column Telemetry Data. Lets understand how is this configured and where is this data coming from and what they meant.

Lets explore following C code base which is responsible for the above display output of the telemetry. Refer to https://github.com/Azure/iot-edge/blob/d2c251d76a231eff3af4ffc4b854031dc9cacdde/samples/ble_gateway/ble_printer/src/ble_printer.c

For each configuration GATT UUIDs , in your configuration file, it is configured to read all the first 7 parameters one time and ready the Temperature every 1 second, which is what the telemetry output you see.

Configuration

From gateway_sample.json

GATT Characteristic IDs

From the ble_printer.c

Telemetry Data

From the IoT Edge run

image image

clip_image001[9]

From the temperature telemetry, displayed as raw Ambient temperature read from the IR sensor, and raw Object temperature.

Understanding the Telemetry Data from monitor-events

Below is the iothub-explorer tool running under the monitor-events mode and displaying each messages received from the connected devices (This is referenced as D2C messages).  What you see from each D2C message is BLE device Index, timestamp, the UUID and source, but there are no telemetry data!

From the above telemetry configuration and the fact that

image

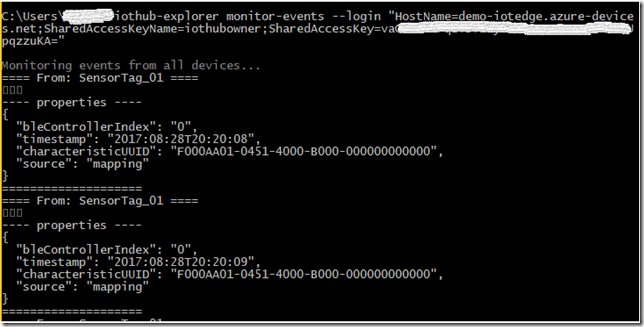
From above, the --- properties ---- is the actual raw telemetry sent by the Sensor Tag to the Pi. This is the raw data and not in JSON format and there is no actual temperature data. The UUID is for temperature signature. More on this later if I am able to discover details on the code base as to how we can fix this to send well formed JSON. Again I will update the Conclusion section to provide the solution in a later blog.

Connecting this telemetry output to do Hot Path/Warm Path/Cold Path analytics

Let me quickly define each of these IoT Analytics approaches:

  • Hot Path: As messages coming to IoT Hub, you want to perform your analytics as quickly as possible since these are time sensitive scenarios.  That means resources with higher cost to get the quickest results is acceptable.
  • Warm Path: As messages coming to IoT Hub, you want to perform your analytics soon enough that a business defined delay or lag in determining the results is acceptable. That means resources with moderate cost to get the results in business defined time lag is acceptable.
  • Cold Path: You want to perform your analytics with historical data to derive insights. That means resources with lowest cost to derive the insights is acceptable.

My narrative here is to distinguish each analytics approach in the IoT pipe-line. Your definition may  differ.

Lets review how we can begin to approach Hot Path analytics such that we can visualize the data real time in a visualization tool. Following an existing article guidance Visualize real-time sensor data from Azure IoT Hub using Power BI, lets create necessary resources, like wise here I am sharing the results under each sections from the article.

Add a consumer group to your IoT hub

clip_image001[1]

Create a Stream Analytics job

image

Add an input to the Stream Analytics job

clip_image001[3]

clip_image001[5]

Add an output to the Stream Analytics job

clip_image001[7]

clip_image002

clip_image003

clip_image004

clip_image005

clip_image006

Run the Stream Analytics job

clip_image007

Now as you will notice there is a warning sign from the input that we created, lets further explore that by click on the input.

clip_image008

The warning clearly states the issue. Like mentioned in the Part I blog, the messages that are sent to Iot Hub are not in JSON format.

clip_image009

Lets take this how we can resolve this and follow the Conclusion section. Again I will update the Conclusion section to provide the solution in a later blog.

Connecting additional SensorTags to the same Raspberry Pi IoT Edge Gateway

The fundamental idea of a Gateway concept in IoT Scenarios is that the device or a thing that plays the role of Gateway is that it can connect to many things and play a role of gate keeper to talk further with the Cloud.  In Part I we connected a single SensorTag. Here lets explore how we can connect a second SensorTag device.

I had bunch of old SensorTag CC2541, these are 1st generation and no more sold. But for the purpose of this experiment, this works.

Office Lens 20170830-110933

First lets ensure that you are not running the IoT Edge, otherwise stop the run.

From the Pi SSH session, lets initiate Bluetooth shell and try connect this 2nd sensor tag and find out the MAC address:

image

Lets Power On the 2nd sensor tag

image

image

Note the MAC  78:A5:04:8C:13:98

Enter scan off to stop.

image

Now lets connect to this SensorTag in our bluetooth shell

image

Lets disconnect from the device using the disconnect command and then exit from the bluetooth shell using the quit command:

image

image

Now lets add the 2nd SensorTag device to the IoT Hub. Navigate to Azure Portal and to your IoT Hub, Device Explorer and add new sensor tag and make note of the new Primary Key for the SensorTag_02.

image

Now lets take the original sensor tag sample configuration file, lets rename that to gateway_Sensor1.json and test to ensure the configuration works

 image

Take the gateway_Sensor1.json file and copy to gateway_Sensor2.json. Then lets update the MAC address for the sensor two and save.

image

image

Now run the gateway for Sensor 2 to test and ensure the sensor two works, make sure you have the sensor two powered on before the run:

image

Now lets create a 3rd configuration file that will have both sensors. Copy the Sensor1 file to gateway_Extend.json. Add the 2nd SensorTag device in the configuration file via nano editor from your SSH session:

image

Locate the Mapping section, notice that under the args where we had our first Sensortag entered, I have comma separated and added our second sensor tag with respective MAC and Primary Key for the deviceKey.

image

Next locate the below section

image

Copy and paste an existing section of the “controller_index along with the instructions separated by comma (like curser green highlight below. Update the controller_index  with 1 and replace the respective MAC address.

image

image

Save the configuration Ctl+O and exit Ctl+X. Lets copy the content of the file and test to ensure the JSON is welformed. I used

https://jsonformatter.curiousconcept.com/ to test.

Now run the IoT Edge Gateway from the Pi. From the bellow error message, it looks like even thought the configuration is well formed JSON, the JSON parsing modules are not able to read appropriate configfuration sections where we extended with the second BLE controller.

image

Again I will update the Conclusion section to provide the solution in a later blog.

Conclusion

So in conclusion, I am expecting to find out more clarity on the SDK and being able to perform above tasks of correcting the Telemetry message so that it is a well formed JSON and that I can add more than one SensorTag and run a successful IoT Edge.

As I discover more clarity I will update here for next set of blogs to shed some light on these topics.

Tuesday, August 29, 2017

Developing Azure IoT Edge-Part I

Overview

If you are evaluating for building out an IoT Edge Gateway and experimenting with Microsoft Azure IoT, in this blog I have shared the experience of building out and deploying an actual IoT Edge using Microsoft IoT Edge Gateway SDK. There is an official document Use Azure IoT Edge on a Raspberry Pi to forward device-to-cloud messages to IoT Hub. This is very good generic guideline document.  For clarify here I am sharing the actual steps for those who are trying to build this out.

(You can see that I have been switching between the actual session on the Pi via the connected Keyboard/monitor/mouse vs some time in the SSH session. This could be simple, I just happen to use these as I went through the debugging effort to ensure all works well.)

What do you need to get started?

I won’t repeat what is already  been document in the above referenced article, so I suggest you read the document first to understand the modularized architecture of Azure IoT Edge SDK.

In this case I am building out from the Windows 10 and then SSH in to the Raspberry Pi via Putty. My commentary will be to share my guidance to on the order and to resolve  any issues you may come across while building out the Iot Edge Gateway. 

In the end pay attention to the Conclusion section as I capture the clarifying questions and thoughts on extending the Gateway.

So continue with the steps in the article and compare my blog to make sure you get your steps correct. I have outlined each major sections to give you context of which section my guideline convers.

Development Steps

From here on, continue to follow the steps as described in the referenced article and cross check with the section heading as below to validate your steps for guidance.

Prepare your hardware

In this section you will need to know the IP address of the Raspberry Pi. Connect Keyboard, Monitor and Mouse to the Pi.  Since the Pi 3 has WiFi, you can connect to Wifi or Ethernet as convenient to you. I had my setup as below. I had the Pi in a 3D printed case. The purpose of this setup is to ensure that the Pi is booted adequately and other debugging steps when I could not connect to the Pi via the SSH tool from the Windows/Mac desktop. If you had your Iot Edge is configured  and everything running fine you would not need the the Keyboard/Monitor/Mouse.

clip_image001

While the Pi is all installed and booted with Raspbian, run the terminal tool in the Pi to get to the command prompt. Run below command to get the IP address:

hostname –I

<IP Address is displayed>

image

Office Lens 20170828-191406

Sign in with SSH

In this section, you are trying to connect your Pi via SSH from your Windows/Mac PC. You may receive an error message such as below.

clip_image007

Since the Pi has just been installed and booted with Raspbarian, the base OS image many not have OpenSSH. So lets switch back to the Raspbarian in the Pi terminal window and run following command to install the openssh client:

sudo apt-get install openssh-server openssh-client
[ENTER PASSWORD]

Once above install complete, run below command to start the SSH service.  If you had resterted the Pi, run below command to ensure that SSH servie is running.

Sudo service ssh restart

Reference From <https://askubuntu.com/questions/30080/how-to-solve-connection-refused-errors-in-ssh-connection>

Now back on your Windows/Mac, try connect with your SSH tool and  you should be able to successfully establish SSH connection to the Pi.

image

Enable connectivity to the SensorTag device from your Raspberry Pi 3 device

In this section it took me couple of tries and reboots of Pi to ensure the bluetoothctl --version was 5.37 as expected to match.

In this section at step “6, Make the SensorTag device discoverable by pressing the small button (the green LED should flash). The Raspberry Pi 3 should discover the SensorTag device:” 

First ensure you have inserted the battery provided with your SensorTag BLE device. As outlined in below picture, press the button and observe the green LED to flash to indicate that the device is now on.

imageclip_image046

In the step 6  “In the interactive bluetooth shell, enter the command scan on to scan for bluetooth devices. The command returns output similar to the following:” In this step we are scanning for our BLE device and finding out the MAC address.

clip_image003

Make note of the MAC address of your sensor tag from the above output as below:

A0:E6:F8:B6:42:87

Step 8 “Connect to your SensorTag device using its MAC address by entering connect <MAC address>. The following sample output is abbreviated for clarity:” In this step, you are pairing the SensorTag with your Raspberry Pi.

clip_image004

Step 9”You can now disconnect from the device using the disconnect command and then exit from the bluetooth shell using the quit command:

clip_image005

clip_image006

This should complete the “Prepare your hardware” section

Run the IoT Edge BLE sample

The is the meat of the article and this is where you would be building and deploying your IoT Edge on the Raspberry Pi.

But first section is about creating an IoT Hub in Azure and adding a new device (to represent the SensorTag BLE device) from the section “Configure two sample devices in your IoT Hub”. Follow the linked article to create an Azure Resource Group and then create an IoT Hub. In the main article, it was assumed that you would know how to add the device and find the device key. To that end, here I am providing a guidance for this step.

From the Azure portal, navigate to your IoT Hub under the resource group you created above.

From the IoT Hub features, select Device Explorer.

clip_image023

From the top toolbar, click on Add to add a new device.

image

Enter the suggested Device name under the Device ID.  For all practical purposes, for example in a factory floor, this could be each of your machine that you would connect to the Gateway, such as Machine_01, Machine_02  etc.

image

Save to add the above device and after successful add, you should see the below Device Details blade. From the details blade, copy and note following fields by clicking on the copy button at the end. You will need these for future steps. (Secure these keys as this is what authenticates the Device and the device commination with your IoT Hub and hence I have masked my keys below)

  • Device ID
  • Primary key
  • Connection string—primary key

image

As mentioned in the article,  alternatively you can use below scripted steps to add a device to your IoT Hub and retrieve the Keys.  But first you will need an IoT Hub Connection String. Lets get that from the portal.

First step, from the Azure Portal, from the IoT Hub, choose Shared access policies and choose “iothubowner” policy.

image

Next for this Access policy, copy the Prime Connection String

clip_image001

Make a note of this Prime Connection String, which looks similar to below, (key masked).  If you notice, this connection string has SharedAccessKeyName, which is want distinguishes what your device can do with this key. You can always create your own Access Policies with specific permissions and use. For this step, lets stick with the iothubowner to establish the connection from the tools.

HostName=demo-iotedge.azure-devices.net;SharedAccessKeyName=iothubowner;SharedAccessKey=vaC-------------------------------------------------=

For the below step, The login operation on iothub-explorer tool, provide the above connection string and the tool will confirm the connection session.

image

Once the connection is established, now lests add your new device like below. (This is same as adding the device from the browser.)

imageFrom the above step you can make note of the keys/connection strings for future steps.

Build Azure IoT Edge on your Raspberry Pi 3

Now switch to your SSH session you had established earlier and ensure you are logged in to the Pi and at the terminal install dependencies for Azure IoT Edge: 

clip_image010

Cloning the IoT Edge code base to your home directory:

clip_image011

Building IoT Edge which creates a Build folder every time you build.

image

Configure and run the BLE sample on your Raspberry Pi 3

Instructions on how to edit the sample configuration file. Here I am using the nano editor tool and pointing the path to the sample configuration jason file.

clip_image012

Logger configuration

Before you start with the Logger Configuration step you first need to create a folder for convenience  to hold your Log file. You can use the SSH session for this step as well or for simplicity (for non Linux users) I used the File Manager to locate and create an appropriate folder . 

Office Lens 20170828-194538

clip_image014

Next since the IoT  Edge expects the actual log file to exist, lets create an empty file by right clicking and choosing to create an empty file. I gave a name such as myiotedgelog.log

Office Lens 20170828-194835

Back on the SSH session, while in the nano editor, scroll down and locate the “Logger” section.

clip_image013

Like highlighted above, replace with the full path including the log file name.


clip_image016

BLE Module configuration

From the above step, while in the nano editor , locate the Sensor tag in the configuration file. From the highlighted text, replace with your BLE device MAC.

A0:E6:F8:B6:42:87

clip_image017

clip_image018

IoT Hub module

From the above step, while in the nano editor , locate the IotHub tag in the configuration file. From the highlighted text, replace with your IoTHub Name which is the first part in the hostname that you can copy from the Azure Portal from IoT Hub overview panel.

clip_image020

demo-iotedge.azure-devices.net

clip_image019

Likewise, replace the IoTHubSuffix like below.

demo-iotedge.azure-devices.net

clip_image021

Identity mapping module configuration

From the above step, while in the nano editor , locate the mapping tag in the configuration file. Under the args,  replace the Device ID and Device Key with your Device configuration that you had made note earlier.

clip_image022


image

Now save the configuration file with Ctl+O.

clip_image028

Running the IoT Edge.

I ensured that the BLE device is running by simply pressing the on button from the step “Enable connectivity to the SensorTag device from your Raspberry Pi 3 device” .  Then run the ble_gateway like below. You can see the telemetry from the BLE  device being transmitted to your IoT Edge running on your Pi.

image

For testing purpose I picked up the BLE device and gently blew some air from my mouth for few seconds to increase the temperature. As you can see from your terminal read out the temperature readout started to increase.

image

More on how this information is derived from the SensorTag, read the Conclusion section.

Using iothub-explorer to monitor device telemetry

From your Windows/Mac, assuming you have installed the iothub-explorer tool, you can monitor all the messages that the IoT bub is receiving. In the below command, ensure you are providing the primary key connection string from the IoT Hub Shared Access Policies  configuration.

image

More on what is this telemetry data coming from SensogTag_01, read the Conclusion section.

Running this setup for quite some time now and you can see I have received quite a number of messages at our Iot Hub.

image

Send cloud-to-device messages

Following instructions in this section of the article, you can use either the Device Explorer or the iothub-explorer to send the device messages. now you can also send the messages to the connected IoT Devices right from the IoT Hub blade in the Azure Portal and thats what I am going to explore here.

From the Azure portal, navigate to your IoT Hub blade. click on the Device Explorer option and choose your device.

clip_image037

clip_image038

From the toolbar, choose “Message to Device” button.

clip_image039

Executing the step 1.Reset all LEDs and the buzzer (turn them off):

clip_image040

After a message is sent successfully, you will see an immediate message on the portal.

image

From the gateway telemetry you will also notice the Scheduling a new instruction message:

image

Next executing the Step 2. Configure I/O as 'remote':

clip_image042

clip_image043

Turn on the red LED

From <https://docs.microsoft.com/en-us/azure/iot-hub/iot-hub-iot-edge-physical-device#comments-container>

clip_image044

Office Lens 20170829-110912

Green LED

clip_image045

Office Lens 20170829-111005

Buzzer

clip_image047

At this time I want to ensure I close out the SensorTag with proper messaging and hence I am send the Clear all message.

clip_image048

Conclusion

Following the article and this guidance for the most part you should be able to successfully deploy the IoT Edge gateway.

What I want to take this further for clarity and to extend this to real scenarios are following thoughts:

  • What was the actual telemetry that came from SensorTag to Raspberry Pi in the --- properties ---- from the out put in the iothub-explorer monitor-events?
  • How is the telemetry message from the out put of the  IoT Edge run in the Pi showing the temperature and what are they?
  • Can I further connect this telemetry output to do Hot Path/Warm Path/Cold Path analytics?
  • Then can I connect additional SensorTags to the same Raspberry Pi IoT Edge Gateway? (After all that is the role of the Edge Gateway)

Follow for above answers in my next blog: Dissecting and Experimenting to Extend the IoT Edge Gateway-Part II